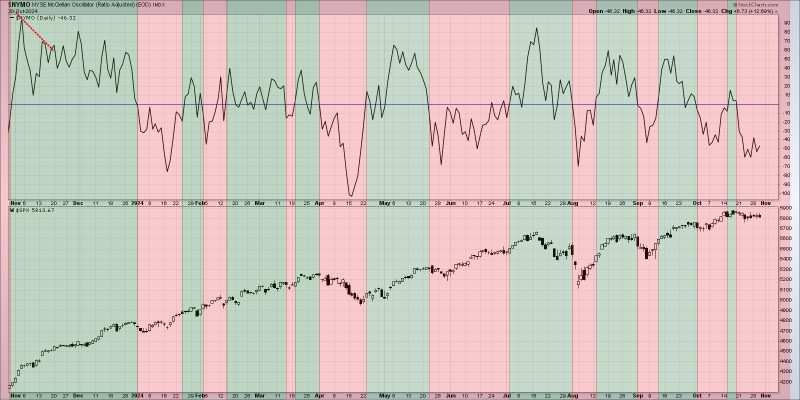
Breadth Divergences: A Sign of Volatility Ahead?
Technical analysis in the world of trading is a valuable tool used by investors to make informed decisions. One such indicator that analysts often look at is market breadth divergence. Market breadth refers to the number of individual stocks that are participating in a market’s rally or decline. When there is a divergence between the performance of the overall market index and the individual stocks that make up the index, it can signal potential volatility ahead.
Market breadth divergences can be classified into two main categories – positive and negative divergences. Positive divergences occur when the market index is moving higher, but fewer individual stocks are participating in the rally. This could indicate that the market rally is losing strength and may be unsustainable in the long run. On the other hand, negative divergences happen when the market index is falling, but a smaller number of individual stocks are declining. This situation could suggest that the market is oversold and due for a bounce back.
Analyzing market breadth divergences can provide traders with insight into the underlying strength or weakness of the market trend. By looking beyond the surface level movement of the market index, investors can gauge the breadth of participation among individual stocks and sectors. If only a select few stocks are driving the index higher while the majority are lagging, it could be a warning sign of an impending market correction.
It’s important to note that market breadth divergences are not foolproof indicators of future market movements. They should be used in conjunction with other technical analysis tools and fundamental data to make well-rounded trading decisions. Additionally, the market can remain irrational longer than expected, so it’s crucial to have a risk management strategy in place to navigate potential market volatility.
In conclusion, monitoring market breadth divergences can provide valuable insights for traders looking to navigate the complex world of financial markets. By paying attention to the participation levels of individual stocks within the broader market index, investors can better assess the underlying strength of the market trend and potentially anticipate changes in market direction. While market breadth divergences are just one piece of the puzzle, incorporating them into your trading strategy can help you stay ahead of the curve and make more informed investment decisions in an ever-changing market environment.
